Portfolios
Add to New Portfolio
Top Layer 1 (L1) Coins by Market Cap
The Layer 1 (L1) market cap today is $1.85 Trillion, a -1.7% change in the last 24 hours.
Read More about Layer 1 (L1)
Layer 1s are the foundation level of a blockchain. They are the main chain of the network, where blocks are added and transactions are finalized.
Highlights
$54,159,920
Market Cap
1.7%

$27,200,098
24h Trading Volume
| # | Coin | Price | 1h | 24h | 7d | 30d | 24h Volume | Market Cap | FDV | Market Cap / FDV | Last 7 Days | ||
|---|---|---|---|---|---|---|---|---|---|---|---|---|---|
| 1563 |

White Whale
WHALE
|
$0.01750 | 0.0% | 1.0% | 8.8% | 26.0% | $7,829.36 | $7,603,742 | $10,508,736 | 0.72 |

|
||
| 1586 |

Hacash
HAC
|
$9.20 | 0.0% | 6.8% | 32.0% | 25.2% | $47,516.94 | $7,249,948 | $7,251,993 | 1.0 |

|
||
| 1605 |

Cypherium
CPH
|
$0.01201 | 6.9% | 20.7% | 5.6% | 33.1% | $18,113.64 | $6,969,089 | $88,009,722 | 0.08 |

|
||
| 1638 |

Script Network
SCPT
|
$0.02341 | 0.5% | 1.9% | 14.3% | 35.6% | $2,621,211 | $6,561,231 | $23,486,336 | 0.28 |

|
||
| 1893 |

Interlay
INTR
|
$0.02713 | 0.3% | 6.8% | 17.4% | 31.3% | $97,052.77 | $4,138,518 | $27,151,278 | 0.15 |

|
||
| 1924 |

Epic Cash
EPIC
|
$0.2280 | 0.1% | 6.8% | 4.4% | 2.3% | $16,386.67 | $3,948,020 | $4,798,011 | 0.82 |

|
||
| 1933 |

MultiVAC
MTV
|
$0.001125 | 0.2% | 5.9% | 18.8% | 17.6% | $128,768 | $3,890,904 | $11,246,109 | 0.35 |

|
||
| 2139 |

LiquidLayer
LILA
|
$0.3185 | 4.2% | 18.5% | 28.1% | 38.2% | $103,477 | $2,632,795 | $3,191,267 | 0.83 |

|
||
| 2193 |

MainnetZ
NETZ
|
$0.008386 | 0.8% | 5.8% | 45.4% | 62.2% | $247,648 | $2,419,992 | $9,233,517 | 0.26 |

|
||
| 2287 |

Unique Network
UNQ
|
$0.006728 | 0.1% | 7.8% | 17.0% | 9.6% | $54,492.60 | $2,068,319 | $7,014,897 | 0.29 |

|
||
| 2324 |

Aura Network [OLD]
AURA
|
$0.04856 | 0.2% | 0.3% | 1.6% | 8.1% | $27.34 | $1,971,438 | $20,063,990 | 0.1 |
![aura network [old] (AURA) 7d chart](https://www.coingecko.com/coins/30364/sparkline.svg)
|
||
| 2369 |
Kintsugi
KINT
|
$0.7710 | 0.1% | 11.2% | 12.9% | 17.3% | $23,901.84 | $1,795,933 | $7,686,246 | 0.23 |

|
||
| 2680 |

Desmos
DSM
|
$0.01304 | 0.1% | 2.7% | 7.8% | 9.0% | $111.39 | $1,080,804 | $2,111,668 | 0.51 |

|
||
| 3143 |

Bitnet IO
BIT
|
$0.0003272 | 0.1% | 1.1% | 16.2% | 23.4% | $19,631.15 | $488,967 | $488,968 | 1.0 |

|
||
| 3190 |
IXI
IXI
|
$0.00005497 | 0.4% | 3.7% | 12.5% | 27.9% | $532.21 | $451,118 | $1,153,624 | 0.39 |

|
||
| 3337 |

Lyncoin
LCN
|
$0.00002098 | 0.3% | 82.3% | 48.4% | 10.8% | $30,372.61 | $338,653 | $338,706 | 1.0 |

|
||
| 3434 |

Busy
BUSY
|
$0.001092 | 0.8% | 8.4% | 36.4% | 11.2% | $13,850.88 | $278,091 | $278,091 | 1.0 |

|
||
| 3445 |

Kylacoin
KCN
|
$49.06 | 0.0% | 0.5% | 1.2% | 2.9% | $33,460.76 | $272,358 | $272,421 | 1.0 |

|
||

Nuklai
NAI
|
$0.01744 | 2.2% | 0.3% | 31.1% | - | $717,857 | - | $18,072,460 |

|
||||

ULTRON
ULX
|
$0.05701 | 0.2% | 0.1% | 9.7% | 14.7% | $13,674.38 | - | $272,868,652 |

|
||||

Massa
MAS
|
$0.1050 | 0.2% | 2.9% | 12.6% | - | $147,011 | - | $104,926,407 |

|
||||

MUU
$MUU
|
$0.076755 | - | - | - | - | $616.83 | - | $67,550.59 |

|
||||

Coreum
COREUM
|
$0.08987 | 0.4% | 1.0% | 8.6% | 24.9% | $2,338,388 | - | $44,900,854 |

|
||||

3DPass
P3D
|
$0.008070 | 1.7% | 5.1% | 6.9% | 38.4% | $46,385.95 | - | - |

|
||||

Qubic
QUBIC
|
$0.054995 | 0.1% | 5.2% | 32.1% | 9.8% | $4,584,301 | - | - |

|
||||

Spacemesh
$SMH
|
$2.95 | 1.4% | 0.6% | 21.3% | 5.8% | $7,625,813 | - | - |

|
||||

The Root Network
ROOT
|
$0.04221 | 0.2% | 0.4% | 8.3% | 26.6% | $6,131,930 | - | $506,999,638 |

|
||||

Nibiru
NIBI
|
$0.1906 | 0.5% | 8.9% | 34.4% | 47.1% | $2,116,694 | - | $285,606,258 |

|
||||

Wrapped Chiliz
WCHZ
|
$0.1130 | 0.3% | 3.6% | 9.3% | 7.2% | $13,043.03 | - | $158,840 |

|
||||
|
Minima
MINIMA
|
- | - | - | - | - | - | - | - |

|
||||
Showing 101 to 130 of 130 results
Rows
Articles related to Layer 1 (L1)
Market Coverage
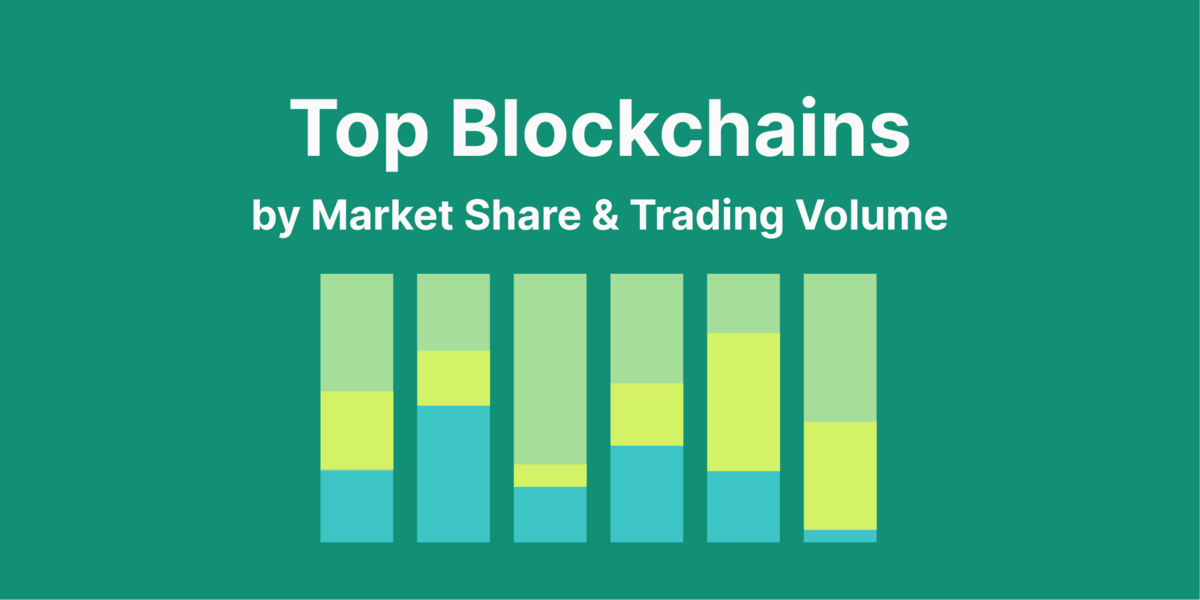
Market Share of Blockchains, by Trading Volume
Shaun Paul Lee

Sponsored Content
A Beginner’s Guide to Injective: A Layer 1 Built for Finance
CoinGecko

API
Create an Interactive OHLCV Candlestick Chart with Python (via Streamlit)
Automation Architech
Market Coverage
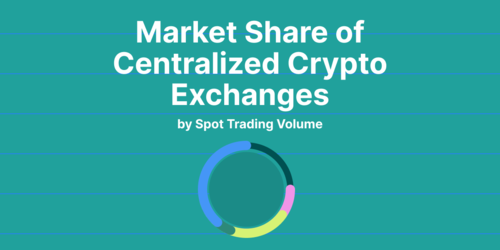
Market Share of Centralized Crypto Exchanges, by Trading Volume
Shaun Paul Lee
4.47 (43 votes)
 Or check it out in the app stores
